

Big Tech Report Card Q3 2026

Updated 1 Nov 2026•10 min read

Cloud accelerates, cash flow tightens | October 2026
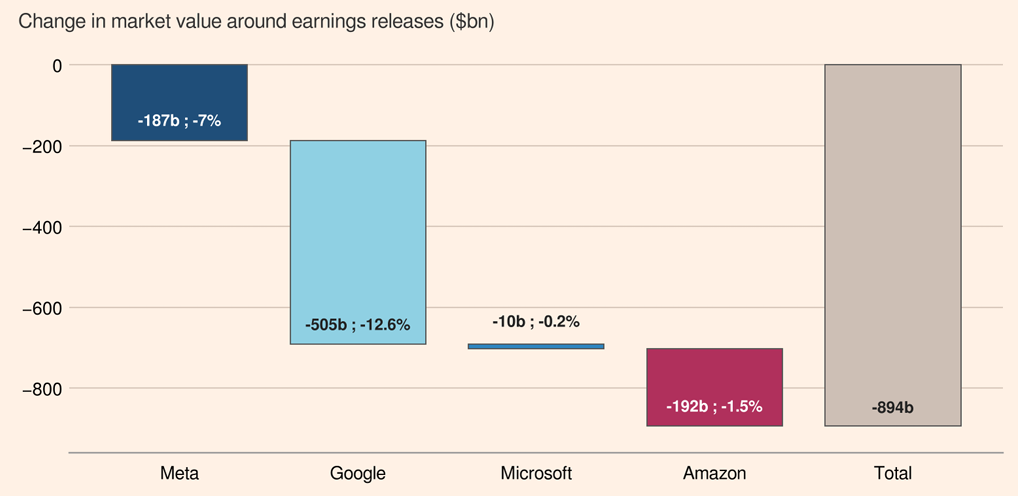
The four largest hyperscalers (Amazon, Meta, Microsoft and Alphabet) lost close to $900bn of combined market value after reporting Q3 results (refer to Exhibit 1). Capex rose 80-120% year on year across the group, and the market reacted more to the scale of the spending than to the earnings behind it.
Exhibit 1: Hyperscalers lost close to $900 bn in market cap recently
Source: Financial Times, "Big Tech sheds nearly $900bn in rout over soaring AI spending"
Growth remains robust
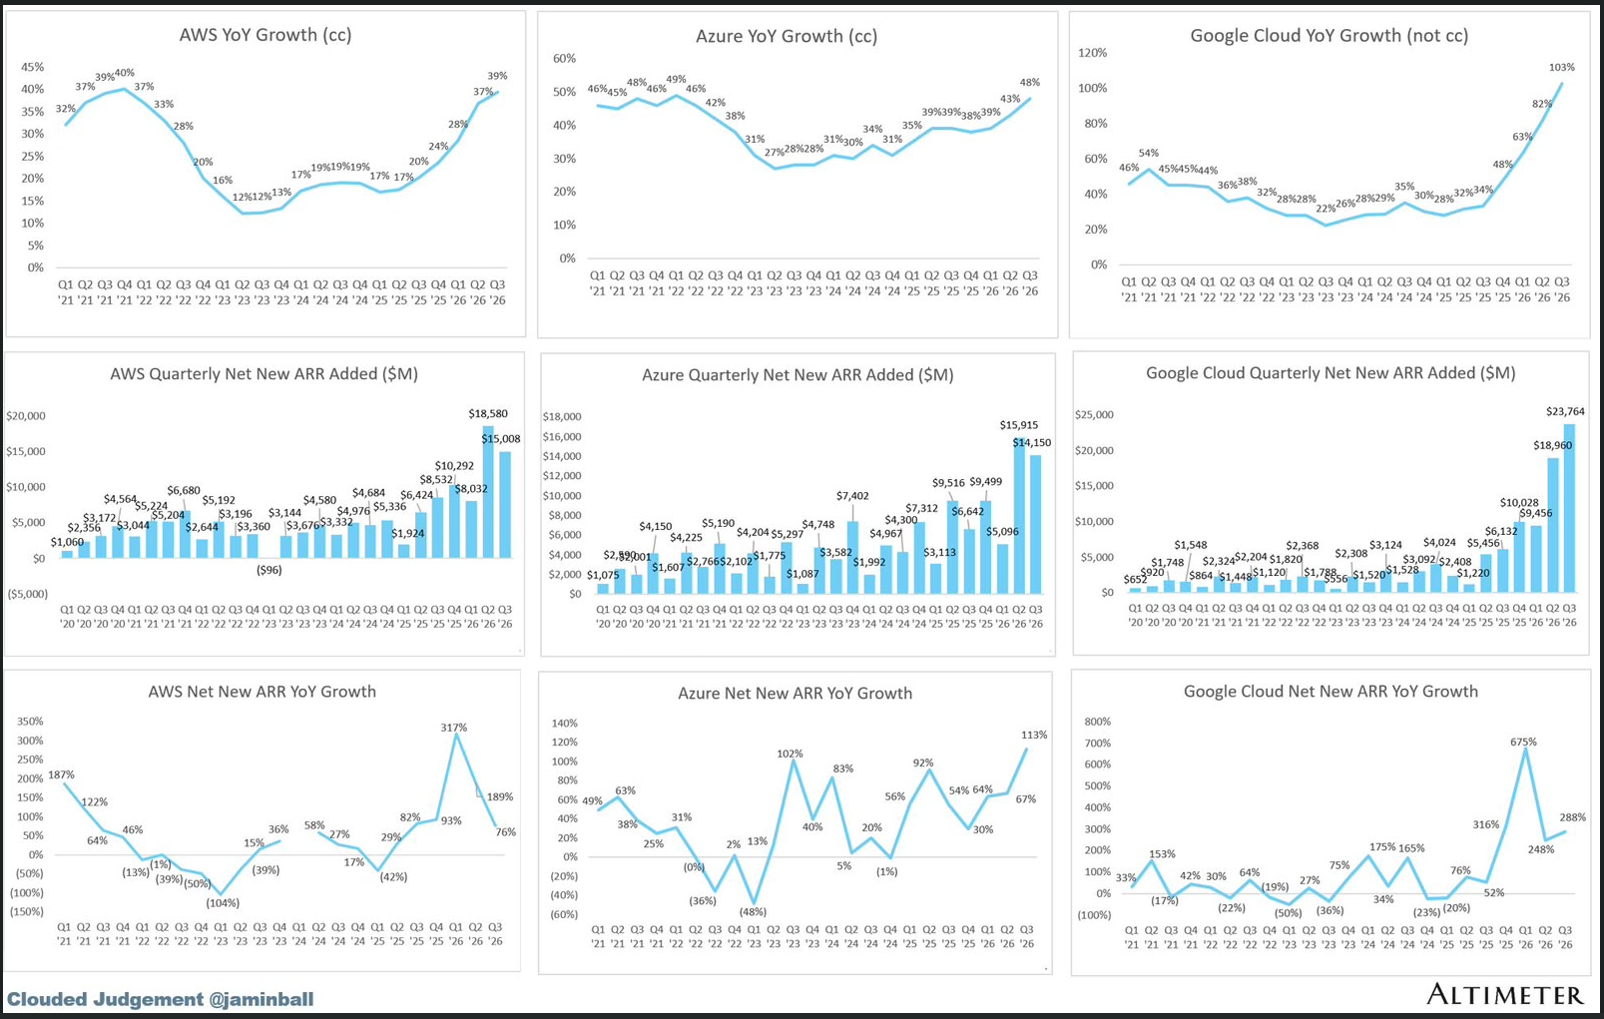
- Growth in the underlying businesses has remained robust across all four companies, with strong acceleration seen in CYQ3 for the cloud business of Amazon (AWS +39%), Microsoft (Azure +48%), and Alphabet (Google Cloud +103%). On top of this, strong backlog numbers ($578bn for AWS, $561bn for Google Cloud and $677bn for Azure) provide multi-year top-line visibility for these names.
- For Meta (who is the only company in this cohort that does not have a cloud business), growth in its advertising business has remained exceptionally strong (Q3 advertising revenue up 26%), driven by improvements to its rankings and recommendations models.
FCF remains subdued
- Despite strong earnings, FCF of all four companies continue to remain subdued due to high capex investments, with Microsoft being the only company in this cohort to remain FCF positive in Q3. With early guidance for capex for 2027 expected to be 'materially' higher, FCF is expected to remain muted (negative for Meta, Alphabet, and Amazon) well into FY27, with markets also factoring FCF outlook and funding requirements into the current valuations of these companies.
- With respect to funding for these investments, Amazon has leaned on debt while Meta and Alphabet are adding a portion of equity to debt. Microsoft remains the only firm to have funded its build-out from operating cashflows (although these are reports suggesting that even Microsoft is now looking at debt-raising options).
Meta
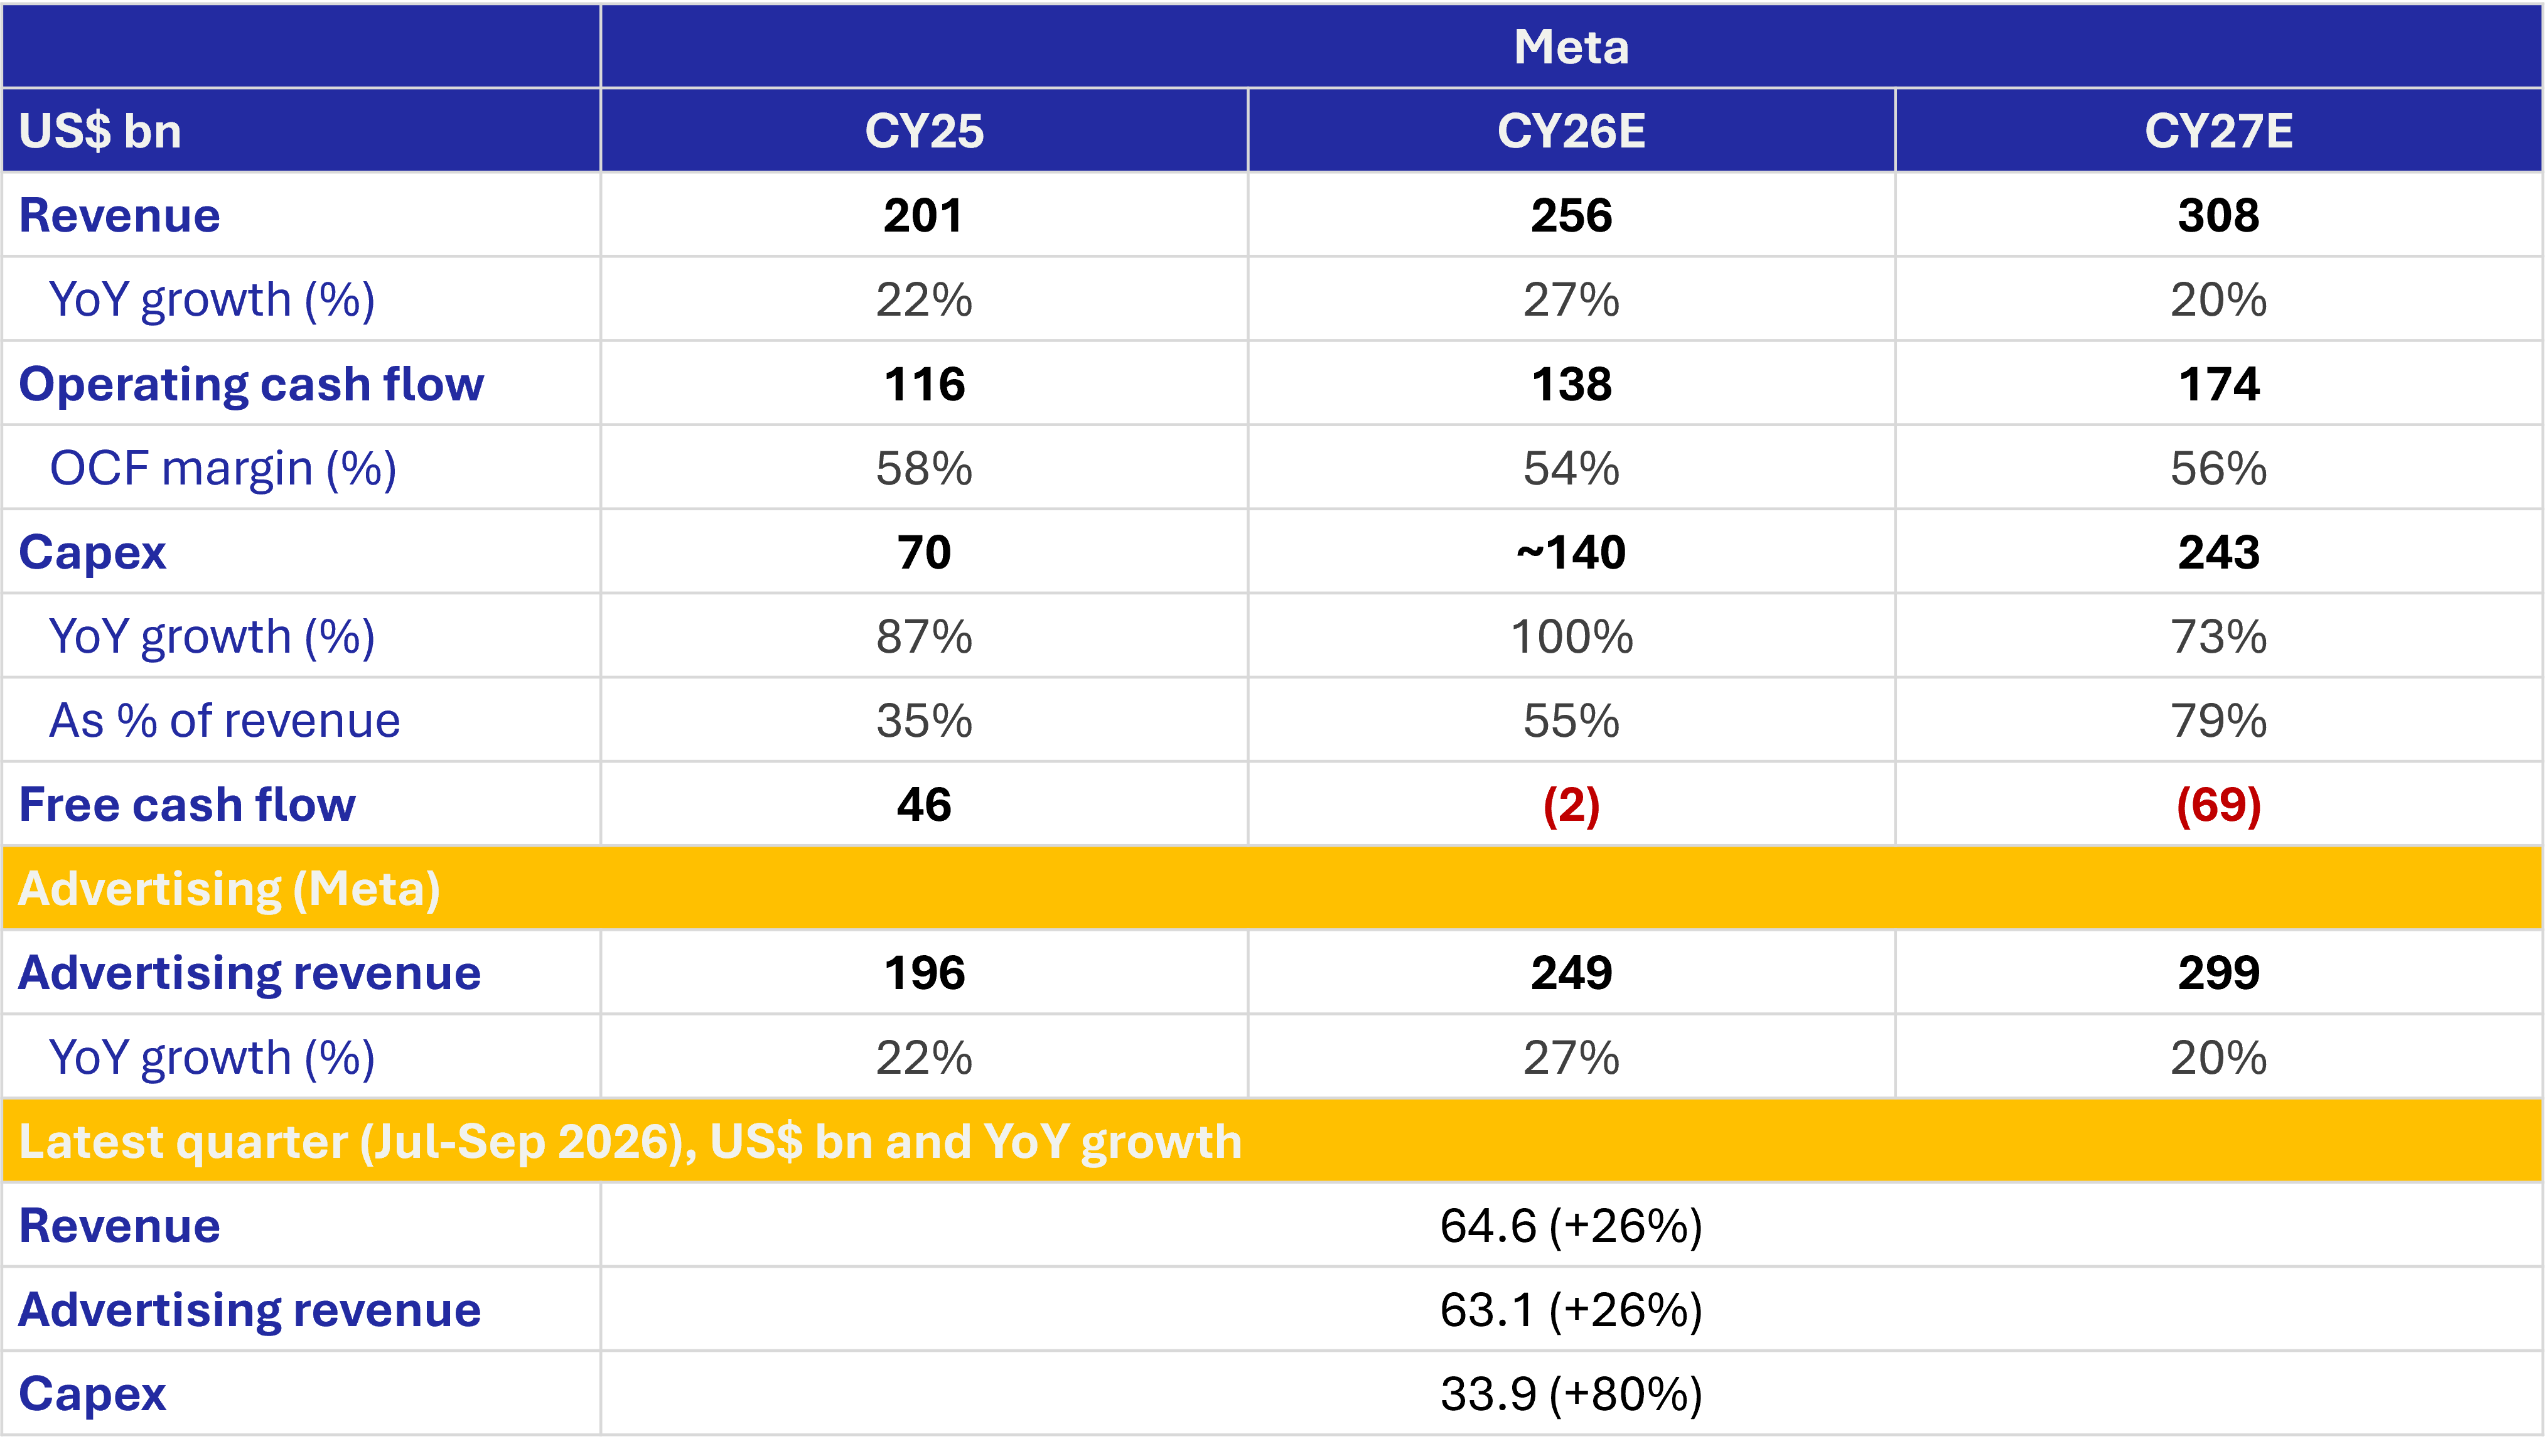
Exhibit 2: Meta; Earnings Snapshot
Source: Company earnings releases and Bloomberg consensus estimates for CY27E
Q3 26: Revenue $64.6bn (+26%); Advertising revenue $63.1bn (+26%); Capex $33.9bn (+80%).
- Meta continues to see improvements in its core advertising business, with growth coming from both higher engagement and stronger advertiser demand, helped by AI-driven improvements in ranking and recommendation that are lifting both time spent and ad conversion. This remains the engine funding the company's AI ambitions, and we view Meta's push into the enterprise business, alongside the planned ramp of Meta Muse (its consumer AI agent), as the key drivers of return on its capex spend beyond core advertising.
- Enterprise demand and ASPs for compute are both rising, and we believe extending into enterprise is a sensible move for Meta. It puts compute to work for paying customers and gives the infrastructure build a revenue stream not solely dependent on advertising. The recent release of Muse Wonder and Muse Wonder Full, along with the hiring of CJ Desai (former CEO of MongoDB) to build the enterprise business, are positive steps towards an adequate ROIC on the capex spend, though execution is expected to take time given Meta is building this capability largely from scratch against established cloud and model providers.
- On the consumer side, the personal agent market is still at a nascent stage, and Muse will compete with other offerings as the market evolves, with distribution strength also remaining a key factor as platforms such as Amazon have moved to restrict third-party shopping agents. Despite that, Meta is seeing early traction for Muse, with room to scale adoption across its large user base and improve compute efficiency per user.
- The key area to monitor is capital intensity: the scale of investments has moved Meta towards external funding, including its ~$95bn equity raise, which makes the pace at which enterprise and Muse revenue materializes more important for returns relative to peers whose AI spend is still largely self-funded.
Amazon, Alphabet, and Microsoft
Q3 26
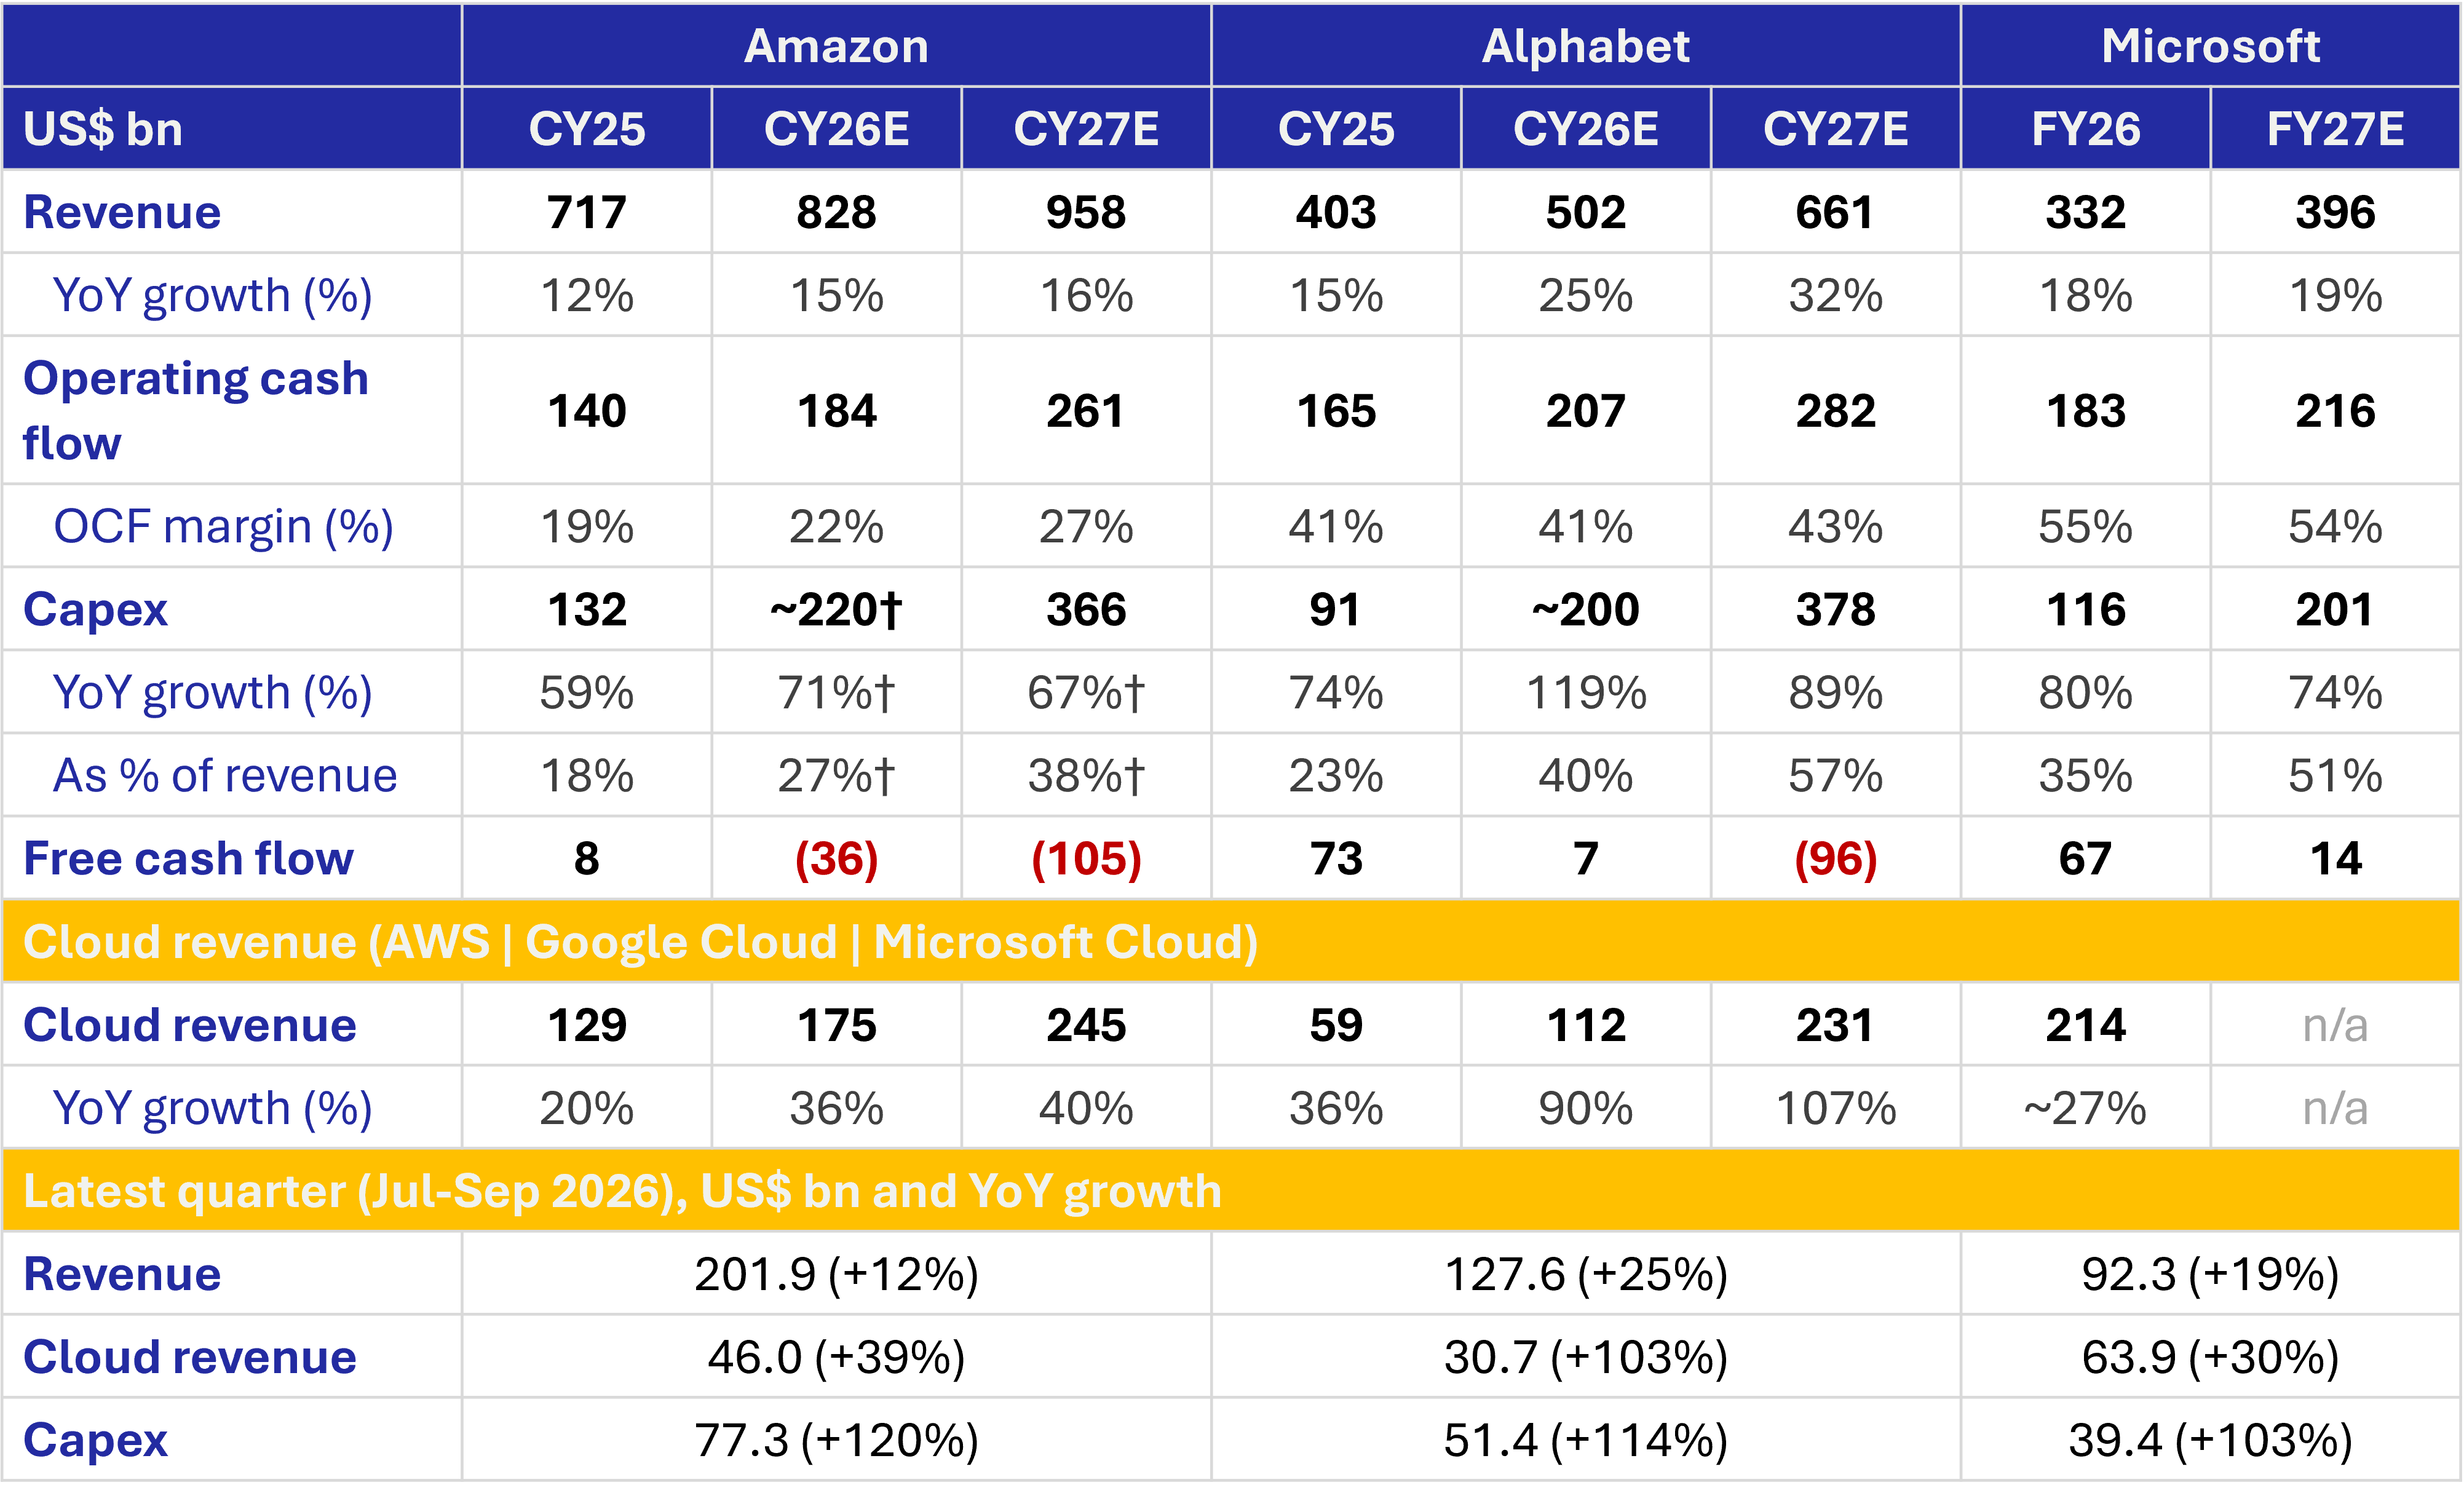
- Amazon: Revenue $201.9bn (+12%); Cloud revenue $46.0bn (+39%); Capex $77.3bn (+120%)
- Alphabet: Revenue $127.6bn (+25%); Cloud revenue $30.7bn (+103%); Capex $51.4bn (+114%)
- Microsoft: Revenue $92.3bn (+19%); Cloud revenue $63.9bn (+30%); Capex $39.4bn (+103%)
Note: Microsoft Cloud is broader than Azure and includes Microsoft 365 commercial cloud, among other services. Azure alone grew 48% in the quarter.
Exhibit 3: Amazon, Alphabet and Microsoft: Good Cloud Growth But Microsoft More Disciplined
Source: Company earnings releases and Bloomberg consensus estimates for CY27E
Exhibit 4: Cloud growth and net new ARR at AWS, Azure and Google Cloud
Source: Clouded Judgement (Jamin Ball), Altimeter
Amazon
- AWS continues to show strong momentum, with growth accelerating for a sixth consecutive quarter to 39% in Q3 ($46bn, a ~$184bn run-rate) while margins remained resilient at 39%. Management is increasingly confident about the medium-term opportunity, guiding for AWS growth of 40%+ in both FY27 and FY28 and framing AWS as a $1trn revenue business within 5-10 years, with a $578bn backlog providing visibility.
- The growth is broad-based: core compute and storage are growing at their fastest rates in several years, and AI-driven tools are making migrations previously considered uneconomical (such as mainframes and storage networks) viable, with ~85% of global IT spend still on-premises.
- We view Amazon as the only player integrated from AI training through to inference and on to enabling AI for the enterprise - letting customers build models on SageMaker, run production inference on Bedrock (Fortune 500 spend up nearly 7x and token volumes up nearly 17x year on year), and migrate existing workloads into AWS with the same data and security controls. Custom silicon adds a further layer: most of Bedrock now runs on Trainium, and revenue commitments for Trainium and Graviton are each up more than 20x. Trainium is also expected to be sold externally from late 2027.
- Beyond AWS, the retail business continues to improve, with group operating margin at a record 13.9% and advertising growing 12% to $19.6bn.
- Spending remains top of mind: Q3 FCF was negative $7.7bn, driven by capex of $77.3bn (from $53.1bn in Q2). Management has guided for capex to rise meaningfully in FY27, and the market is increasingly debating whether part of this will be raised externally through debt or equity - which makes the pace at which the backlog converts into revenue and cash flow the key variable for returns.
Microsoft
- Microsoft has been the most disciplined spender in the group, which coupled with its strong execution, has been appreciated by the markets over the last few months. CYQ3 (F1Q for Microsoft) reinforced that positioning; Azure grew 48%, ahead of its 44-45% guide despite third-party capacity delays, and the F2Q guide of 49-50% in constant currency implies further acceleration. Notably, a meaningful part of this upside came from efficiency rather than incremental spending. Better GPU fleet utilization freed capacity for higher-value workloads, Foundry revenue more than tripled, and token pricing came in better than expected, which helped hold the operating margin near 50%.
- Microsoft has taken a cautiously aggressive approach to AI investment, scaling capex while remaining free cash flow positive ($18.6bn in the quarter on $58bn of operating cash flow) and reiterating positive FCF for FY27, with CY26 capex of ~$170bn moving with capacity delivery timing rather than being pushed ahead of demand. Visibility is underpinned by a $677bn commercial backlog (+73%), and a multi-model approach that lets OpenAI, Anthropic and its own models compete for workloads, reducing dependence on any single model partner.
- The core Microsoft 365 business continues to deliver strong and consistent growth, with Commercial Cloud up 19% in constant currency and expected to accelerate through the year, driven increasingly by revenue per user (E5, the new E7 tier, Copilot and usage-based consumption) rather than seat growth alone. Areas to monitor include lack of Copilot seat disclosures, lumpy commercial bookings, continued weakness in Windows OEM, and management's new reference to accessing additional sources of funding as capex re-accelerates into 2H FY27.
- Despite that, Microsoft has so far shown the most balanced combination of AI growth, margin resilience and self-funded investment among the hyperscalers.
- Alphabet's investment case now rests on three monetization engines at different stages of maturity. Search remains under scrutiny for the impact of AI, and monetization of AI Overviews and AI Mode remains a key variable to watch. Engagement though has remained strong, with query growth at a five-year high and AI Mode queries largely incremental. AI Mode though currently monetizes below traditional search, so the pace at which ad load and pricing catch up (with AI Mode ads now expanding internationally and multi-turn ads launching in the US) may shape Search growth from here, particularly after a softer 3Q (+12%).
- Google Cloud Platform is the clearer near-term driver, with monetization increasingly coming from enterprise AI adoption following the broader rollout of Gemini Enterprise last quarter (now a suite spanning agents, knowledge work, data and security; used by nearly 90% of the Fortune 100 with over 100mn seats sold, and pulling through compute, storage and database revenue). This supported Cloud growth of 103% at a 36.2% margin, while the $561bn backlog provides good visibility (though near-term Cloud margins will reflect the ramp of third-party compute capacity).
- The third leg, hardware design and compute distribution through TPU system sales (now delivered into customer data centers and through partners such as Oracle), gives Alphabet an additional lever to accelerate growth, with management expecting a meaningful TPU revenue ramp in 2027. While the business still relies on a small number of large AI customers, the progress in adding new TPU customers (100+ significant users, including Apple) is a positive step towards broadening it. The trade-off is capital intensity: capex and TPU inventory build pushed 3Q free cash flow negative, and FY27 capex is set to increase significantly.
- We believe the conversion of this investment into returns will determine the earnings trajectory into 2027.